Interactive Fine Art
[ Individual Project on Web ]
Project Overview:
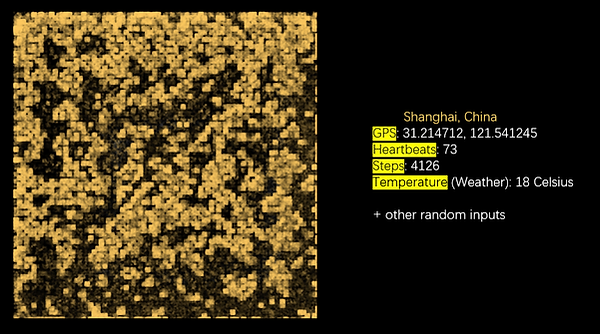
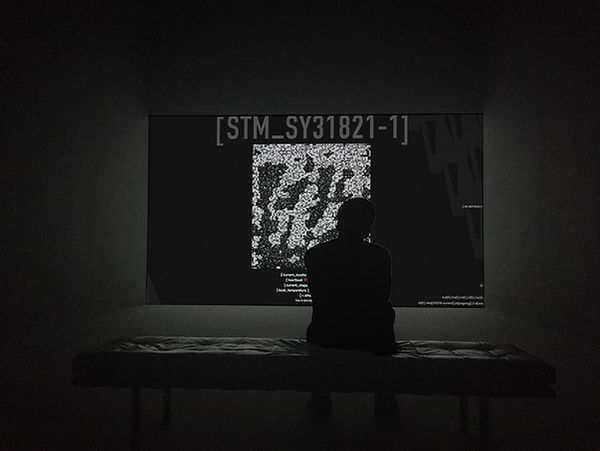
This is an interactive art project idea that I generated as one of my final pieces for my research at Roski. In this project, I want to visualize my personal and current data such as my GPS location, heartbeat, local temperature, how many steps I make, etc. I have made a working system for such visualization and graphic generation part, but I failed to technically extract data from my personal phones/monitoring devices and constantly feed it to the server I rented because I couldn’t find a way to access those data (apple and google kept those data very secured and private).
3WHU~%5BDB5244.png)
Platform:
The simulation of the project is installed online, coded with HTML. The graphic is generated by Processing.
YG(BN.png)
Inspiration:
As a Gen Z, I am fully aware of the fact that our data and privacy is constantly tracked by various systems including organizations, or for-profit companies such as Apple and Google. So, I always wanted to create a project to conduct Self-targeted surveillance and display those data or data-sensitive visuals either online or in a gallery space setting. Those data and visuals are highly coordinated, so I will be performing constantly, no matter where I am and what I do. Inspired by many artists such as Tehching Hsieh, I wanted to make this work/performative act durational (such as for the length of 1 year) because I feel like it is more meaningful while also risky. I want to evoke my audience and I want them to reflect upon the nature of our time, about living as data, under all sorts of surveillance.
Rules for data generation:
I used Julien Verneuil’s work Amoeba’s (https://openprocessing.org/sketch/677885) code as a blueprint for my graphic generation and modified it to fit into my system.
Setting up a set of aesthetic rules between data and graphic generation is quite a complicated process because of the nature of my data set. I am dealing with a set of very different types of data. For example, GPS data contains two sets of numbers. Both of these two numbers can be positive/negative. Then there is heartbeat which has a range from 0 to 120 (normally 65-100 for me). Then there is “steps” which grow from 0 to thousands progressively a day. These data are really different compared to each other and inputting them into a rule of visual generation was quite difficult.
As a result, I managed to create a working set of rules: the GPS data will determine the overall hue of the visualization. The heartbeat will determine the initial color while the graphic grows. The steps will shape the visualization from short to long. The temperature will change the speed and intensity of the graphic.

List of implemented data
and sample for their format

Sample data.

Sample data with GPS
coordinates change
The graph turns from red/white to a grey-scale form.

Sample data with
Temperature change
The graph becomes much more aggressive when growing, with a more scattered pattern in the end.
![2U4Q_YE7DU$5[%7RW2E[]YV.png](https://static.wixstatic.com/media/475a21_6d34d86ecf274b0fafce322212b9ba3b~mv2.png/v1/crop/x_23,y_0,w_1268,h_387/fill/w_600,h_185,al_c,q_85,usm_0.66_1.00_0.01,enc_avif,quality_auto/2U4Q_YE7DU%245%5B%257RW2E%5B%5DYV.png)
Sample data with
Steps change
The overall shape and height of the graph is limited.
Aesthetics:
The reason why I choose Julien Verneuil’s work Amoeba as a blueprint for my project is the fact that it looks very organic as if those graphs are specimens. And that is a really nice element that I want to include with my project because I am basically cultivating/always changing my data, allowing the graphic to grow and vary constantly.
However, I did not want the graphic to look entirely organic. So doing my time exploring with the setting of aesthetic rules, I made each cell to generate cubically so that the entire visual resembles QR codes, a very cultural/timely icon for the time we live in.
![YO(TYR]`MFFTQ0}XVGD$Y83.png](https://static.wixstatic.com/media/475a21_01c0b0d8afcd4728ae56540ab7cfaf34~mv2.png/v1/fill/w_798,h_319,al_c,q_85,usm_0.66_1.00_0.01,enc_avif,quality_auto/YO(TYR%5D%60MFFTQ0%7DXVGD%24Y83.png)
Reflection:
I asked many friends of mine, faculty members, as well as professional CS engineers around me to help me look into the possibility of obtaining my live data so I can use it for this performance project. Unfortunately, I still haven’t found a way to do it. Hopefully, I can solve these technical difficulties one day in the future.
I also hope to bring this project further because essentially this live graphic/visual alone is very beautiful and expressive, and it is taking a form of an online and current presence, a status, or even a live avatar. Imagine if everyone has something like this online that displays their situations such as health, emotion, or else.

